Thursday, December 11, 2014

Blog Post Assignment #8

Asking the Questions: Eddie
Answering the Questions: Emily

Q: What have you learned?
A: I learned that bubbly water is good for plants.
Q: What surprised or amazed you?
A: The fact that our plants survived for that long.
Q: What made you laugh?
A: The names we named our plants.
Q: What made you pause and think a little deeper?
A: How we were actually going to set up the experiment and what we were going to do it on.
I wonder what would’ve happened if we continued to water our plants with the water we were testing? What if we planted them in a different area?

Blog Post Assignment #7

Wild Brassica Oleracea plant
The plant we have been experimenting with is the  Brassica Oleracea. Brassica Oleracea has different species, including broccoli, our plant. What makes broccoli different from other forms of the Brassica Oleracea is where the starch is located on the vegetable. We got our seed for our plant from another broccoli plant. The genes from that plant are passed down to the next plant. Genetic information is passed down from generation to generation through gametes, and then are sorted out in the cell during the meiosis process. It is likely that the plant will look like one of the parents, since it is receiving that parent's genes. The Brassica Oleracea has so many different varieties because over time, different traits have been added, which causes different end products.
Our Broccoli Plant


Blog Post Assignment #6

 Our Plant is certainly getting larger. Because of mitosis, the cells are dividing and more and more cells are being produced which causes the plant to get larger. Cells are made by photosynthesis and then move around because of cellular respiration. If a signal was sent to the nucleus to make more Phosphoenolpyruvate carboxylase (PEPC) and ribulose 1,5-bisphosphate carboxylase/oxygenase (Rubisco) enzymes, more proteins would be made since enzymes are in proteins. After that, the rest of the cell would take care of those proteins.

Blog Post Assignment #5

Our Broccoli plant is definitely a living thing because of all the characteristics it displays. Our plant is growing larger and starting to develop some more color. There are even some signs of food growing. If this was not living, the plant would start to lose color and scrunch up with no signs of food. The plant is gaining color because photosynthesis is taking place. The chlorophyll throughout the plant is what is causing the green pigment.

Blog Post Assignment #4

Some abiotic factors that our plant depends on are water, soil, and sunlight. Our plants are competing for resources from the soil, water, and sun. The plants have to compete with the other living things in that area, and needs to make sure that it gets all the resources it needs before it is too late. In order to be a "winner" the plant has to adapt to the environment and get everything it needs in order to stay alive. You can tell who the winners are by seeing if they are the right size, the right color, and are in the right shape. The plant interacts with the bugs and animals that come eat the harvest. The plant is helping the animal stay alive, although the plant does get damaged by this. There is evidence that there is secondary succession occurring in our garden. The weeds are growing on the soil that was already there, which makes it secondary succession.

Blog Post Assignment #3

I did not notice lots of changes in our group’s plant. The brassica oleracea, or broccoli, is doing great, it’s growing bigger and the leaves are turning darker. Our plant will take in the water that is given to it and that is it’s role in the movement of water in it’s cycle. There aren't any signs of animals that show on our plant, and weeds do not affect it yet. The water helps the plant grow, so if the water was taken away, the pant would die. The plant absorbs the carbon dioxide in the air while in process of the carbon cycle. The plant needs sunlight to survive because it gets all of it’s energy from photosynthesis. The plant takes in nitrate and then releases ammonia while in process of the nitrogen cycle.

Meiosis Stop Motion

https://drive.google.com/file/d/0B7Oydb3Lzn6VOEVnOG5qbUJ2V1U/view?usp=sharing

Blog Post 8

Interviewer: Emily Eide
Interviewee: Angelina Taing
Q: What have you learned?
A: I have learned that bubbly water isn’t bad for you and can help plants grow.
Q: What surprised or amazed you?
A: Our plants surviving and the bubbly water not killing our plant.
Q: What made you laugh?
A: The names we made for our plants made me laugh.
Q: What made you pause and think deeper?
A: When we were choosing which water to use to water our plants it made me think about what was in the waters a predict which would make our plant grow more. I wondered what would happen if we kept watering one of our plants with bubbly water and which plant would survive the longest.

Wednesday, December 10, 2014

Blog Post #8 Emily"s Seed Story

Q: What have you learned?
A: I learned that bubbly water is good for plants.
Q: What surprised or amazed you?
A: The fact that our plants survived for that long.
Q: What made you laugh?
A: The names we named our plants.
Q: What made you pause and think a little deeper?
A: How we were actually going to set up the experiment and what we were going to do it on.

I wonder what would’ve happened if we continued to water our plants with the water we were testing? What if we planted them in a different area?
Hypothesis
I believe the more the PH the more bubbles will form.


Materials

  • Mortar and pestle
  • 12 mL Distilled water
  • 3 100-liter plastic beakers
  • 5 mL syringe
  • 2 1 mL syringes
  • 1.5 mL Hydrogen peroxide
  • 1 Paper towel square (for filtration)
  • 5 glass test tubes
  • Test tube rack or holder
  • Small plastic ruler
  • Safety glasses
  • .2 mL Hydrochloric acid solution pH 2-3
  • .2 mL Hydrochloric acid  solution pH 3-4
  • .2 mL Sodium hydroxide solution 10
  • .2 mL Sodium hydroxide  pH 12
  • pH test strips


Procedure

10 ML of water with 5 grams of oat grass
mash those together with the mortar and pestle and filtered it into the beakerAfter
use 1.5 of that solution in each of the five tubes along with .3 of hydrogen peroxide in each tub
.2 of each of the solutions were placed into the separate tubes that were marked for that certain pH
The final step was to measure the change of the different tubes compared to the control
This was done by measuring the height of the bubbles every 5 seconds.


Data


Conclusion

In conclusionFullSizeRender.jpg


Conclusion

In conclusion the more PH the more it varies and goes up and down. Then when there is less PH the more solid the bubbles become. So my hypothesis was incorrect because I thought the more PH the more bubbles will form but they didn’t the bubbles just went up and down

Blog post #8: Interview with Eddie

Interview with Eddie Negrete aka the baller

Q:  What have you learned?
A:Bubbly water is not bad for the plant.  I found that really interesting

G:What surprised or amazed you?
A:  The bubbly water didn't kill the plant.

Q:What made you laugh?
A:  The silly names of the plants made me laugh.

Q:  What made you stop and think?
A:*Eddie thinks to himself*  Where does the first seed come from?

Q:  Did you enjoy this project?
A:  *Eddie thinks to himself*  What a wonderful world. -- Eddie didn't actually say this one. :)

Thursday, December 4, 2014

Blog Post #7

We are experimenting with Brassica Oleracea.  Now, I cannot tell much about its parent plants because I have not looked at thousands of different Brassicas.  But, even I can see this plant's very
prominent red stem.  That may have been something passed down from its parent plants.  It is also hard to predict the traits of this plant's offspring because we have not seen the plant that it would
fertilize with.

However, traits that our plants offspring did get from it would be a result of our brassica's gametes.  These gametes are created via meiosis.  As you can see from the video that you may have just watched meiosis is the formation of haploid cells.  These gametes then fertilize with another plant in order to make new plants.  This is also how our plant ill pass on its genetic information to the next generation.  Since the new plants are being formed with its haploid cells, the new plant has a part of ours in it too.
 
Our plant's offspring will probably end up looking mostly like our plant now, but with a few changes.  We can by no means however, guarantee exactly what it will look like.
 
All Brassica Oleracea are the same species but they are obviously very different.  This is because all Brassica have different genes which make them able to have starch in different areas of the plant.  Farmers over time have realized this and specially bred different brassica in order to get the different varieties that we have today.

Blog Posts Assignment #7

 Our Brassica Oleracea:                                    Cabbage Brassica Oleracea
     

The plant we have  been growing is cabbage, a form of Brassica Oleracea. You can venture to guess how the parent cell will look because it looks similar to pictures of other cabbage plants that i have seen. Other types of cabbages have big, thick leaves with purple stems, our plant also looks similar. The offsprings would be cabbage or some similar plant. They would get their traits from their parent plants through meiosis. The offsprings would probably look very similar to their parent plants, with big green leaves and purple stems. Even though everyone in our class grew some type of Brassica Oleracea, they all look different because we all have different species. There are so many different forms (polymorphisms) that come from one ancestral species because they blend with different species and made new offsprings. 

Blog Post Assignment 7

Our Plant
Brassica_oleracea0.jpg
Wild type Brassica Oleracea
The plant we are experimenting with is in the brassica oleracea family, and the plant in particular is broccoli. The broccoli plant is green, about seven inches tall and has big leaves. Just by observing the plant we can tell the traits it inherited from its parents such as its color, its size, the size of broccoli it produces, and how long it lives for. You can predict how an offspring will look like by putting the genetic information of the parents and putting it into a chart and then read the outcomes. The plant will pass the genetic information through its gametes and the genes will sort themselves out in meiosis. There is a possibility that the plant will look exactly like one of its parents but its highly unlikely the offspring will have a mixture of the different traits. The brassica oleracea look so different from each other because of evolution, adaptation, and the different traits everyone of them has inherited over many years.
If these two plants were to make an offspring the combinations of way it would look like would be infinite. We don’t know which genes are recessive and which genes are dominant in these plants so the answer remains unanswered to determine what the offspring would look like.

Thursday, November 13, 2014

Enzyme Lab Report


Enzyme Lab Worksheet

Hypothesis:

I believe that the higher pH level of the solution is there will be a faster rate of reaction and the lower the pH level is there will be a slower rate of reaction.
Independent Variable:

pH level
Dependent Variable:
bubble reaction speed

Controlled Variables:
Hydrogen Peroxide
Justification of hypothesis:

Why did you choose this as your hypothesis?
I thought the higher the pH the faster rate of reaction because they more acidic the substance would create a faster reaction speed because like chemicals that explode or fizz when mixed normally have higher pH levels.
Materials (Your Team’s Experiment):
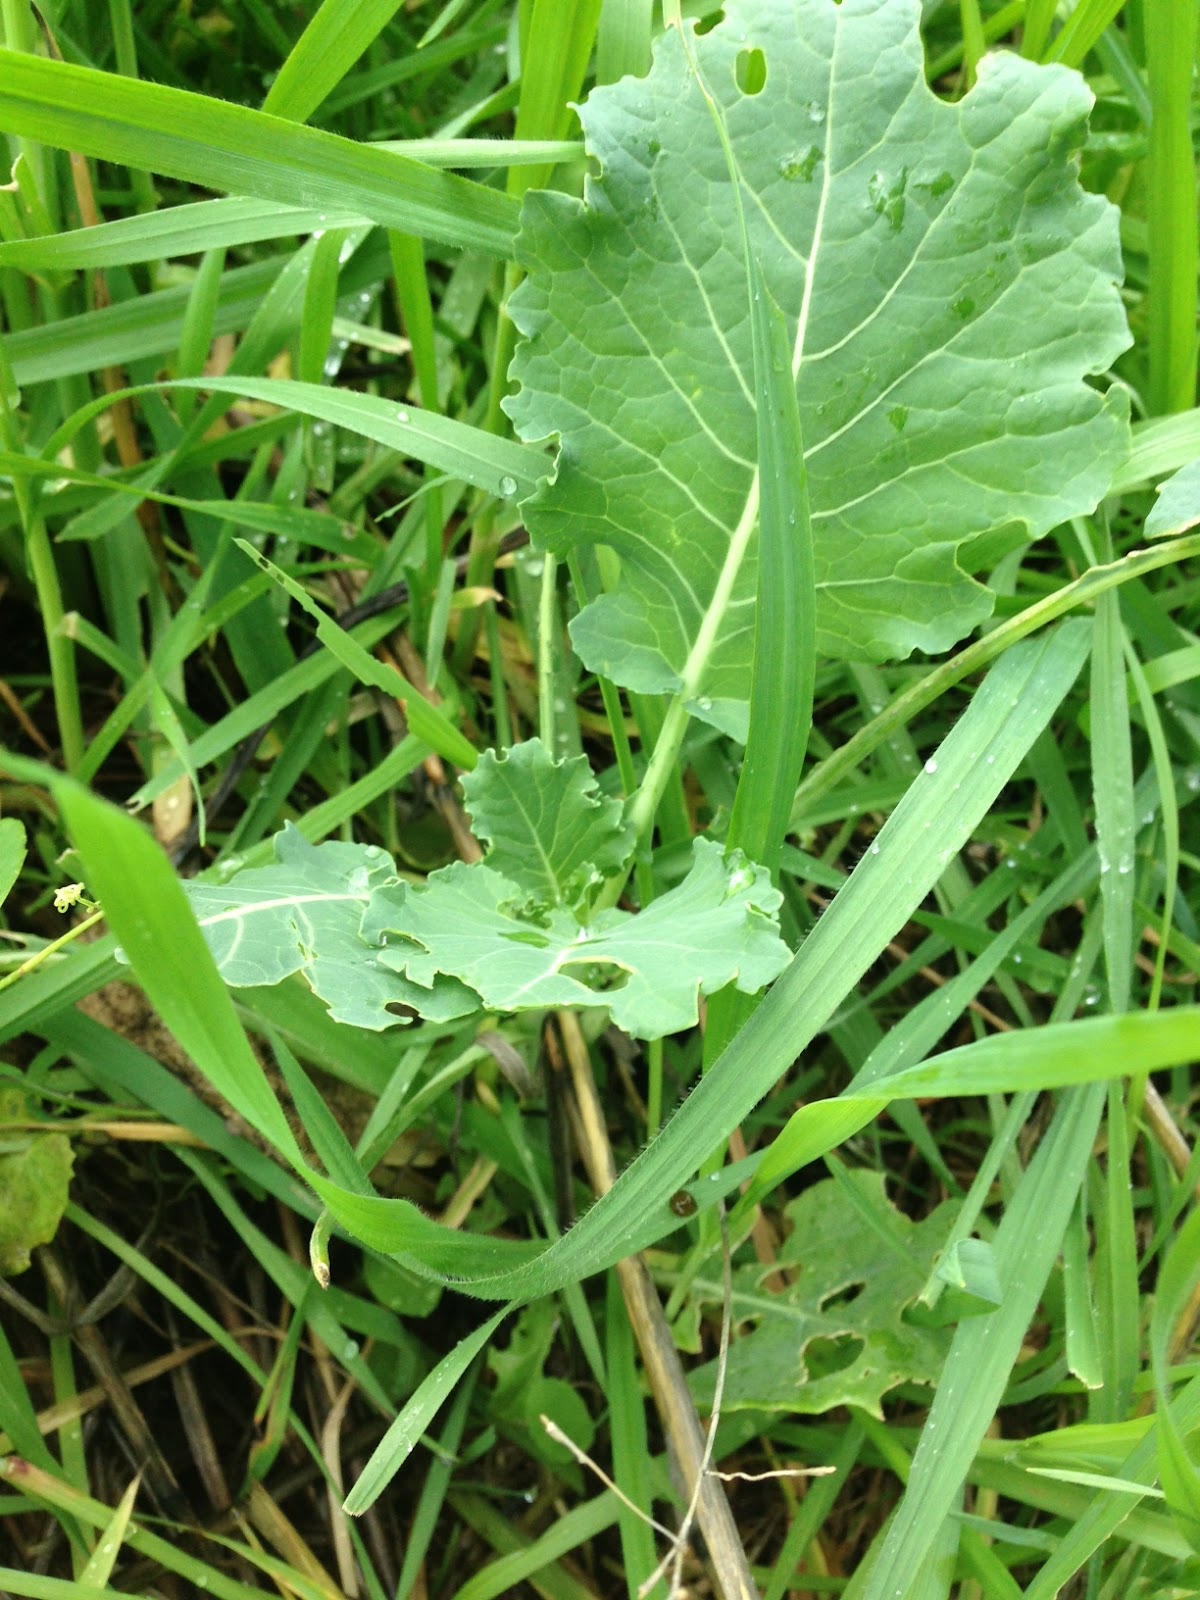
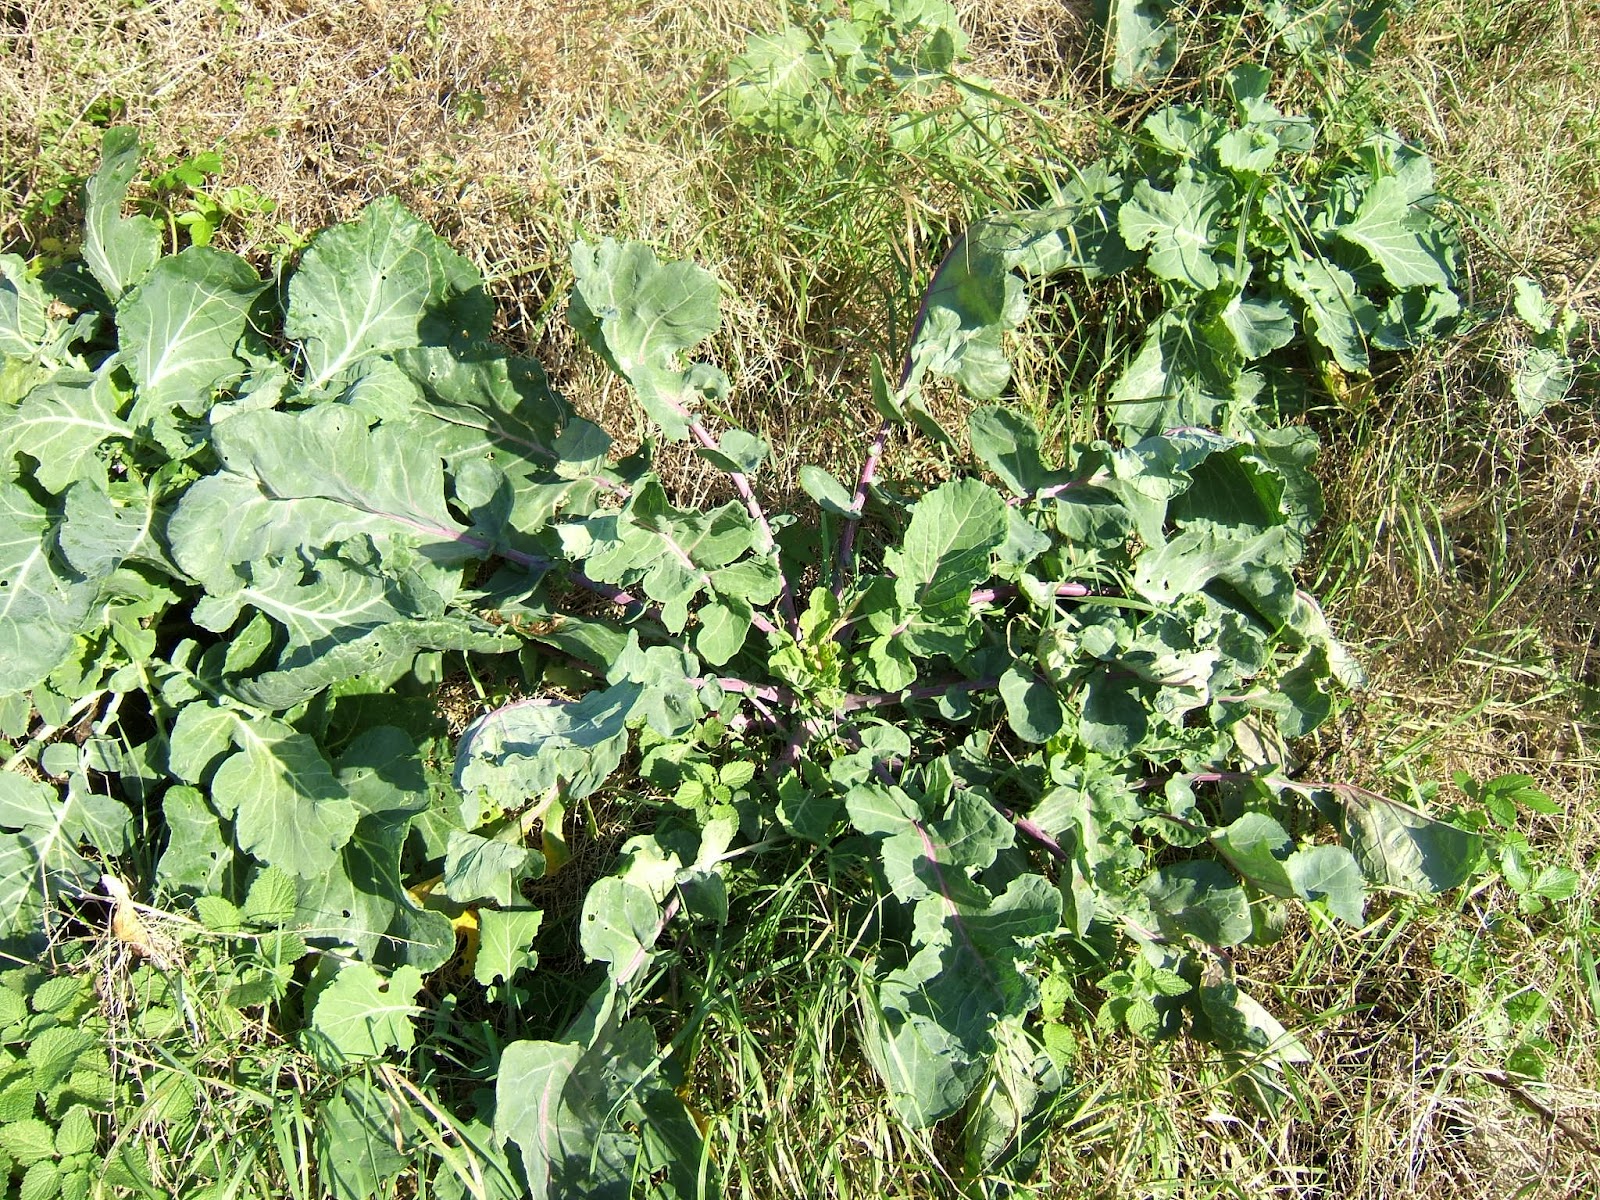
-5-10 grams of bindweed, vines with leaves
-20 mL of water
-mortar and pestle
-300 liter beaker
-Distilled water
-Hydrogen Peroxide
-1 paper towel(used for filtration)
-Glass test tubes
-Small plastic ruler
-Safety goggles
-HCI pH 2-3 or any acid solution with the same pH
-HCI pH 3-4 or any acid solution with the same pH
-NaOH pH 10 or any alkaline solution with the same pH
-NaOH pH 12 or any alkaline solution with the same pH

Procedure:
1)First put 10 grams of bindweed into the mortar
2)Mush up the bindweed together until there are no solids
3)Add 20 mL of water into the mortar
4)Mush it up more for about 2 minutes more
5) Place a napkin over the beaker and filter the bindweed
6)Lightly squeeze the liquid out into the beaker from the paper towel
7)Make sure no solids come out
8)Take 10mm of the bindweed solution in a syringe
9)Put it into the test tube
10)Add 5mm of hydrogen peroxide into the bindweed solution
11)Time and record the data of how much the mixture fizzes until it reaches it’s maximum
12)Redo procedures 1 through 11 but now using HCI pH 2-3, HCI pH 3-4, H2O pH 7, NaOH pH 10, and NaOH pH 12 in place of the hydrogen peroxide
Summary:

Our experiment went well but the most challenging part for my group was filtering the bindweed. Squeezing gently without making a whole or letting any pieces out was complicated. We had to redo it about three times before being able to continue. After getting through that we were able to start collecting data. It happens quickly so you have to pay attention. we would have one person call out times, while another says aloud the rate as another person wrote down the data. Abiotic factors influence the rates of enzymatic reactions by making them faster, biotic factors influence the rates of enzymatic reactions by making them slower.
Detailed Steps:
1)First put 10 grams of bindweed into the mortar
2)Using the mortar, mash up the bindweed together until there are no solids
3)Add 20 mL of water into the mortar
4)Mush it up more for about 2 minutes more until it is like mud and pasty
5) Place a napkin over the beaker and filter the bindweed
6)Lightly squeeze the liquid out into the beaker from the paper towel
7)Make sure no solids come out
8)Take 10mm of the bindweed solution in a syringe
9)Put it into the test tube
10)Add 5mm of hydrogen peroxide into the bindweed solution
11)Time and record the data of how much the mixture fizzes until it reaches it’s maximum
12)Redo procedures 1 through 11 but now using HCI pH 2-3, HCI pH 3-4, H2O pH 7, NaOH pH 10, and NaOH pH 12 in place of the hydrogen peroxide
Data and Results:


Conclusions:
In conclusion we learned that the higher the acidic level the faster reaction rate and the lower the pH level the slower the reaction rate. Our hypothesis was proven correct with our data from the graph above.

Angelina Taing Cell Analogy

https://docs.google.com/presentation/d/1dk4ngQmG4pueiUsZHX7H_1cmAk1yXBEaZDcq70Sjpfs/edit#slide=id.p

Tuesday, November 11, 2014

Peroxsidase Enzyme Lab Report

Materials

  • 5 to 10 grams of freshly picked bindweed vines with leaves (about 1 handful)
  • Digital balance (scale)
  • Mortar and pestle
  • Distilled water
  • 3 100-liter glass or plastic beakers
  • 1 mL or 5 mL syringe
  • Hydrogen peroxide
  • 1 Paper towel square (for filtration)
  • Glass test tubes
  • Test tube rack or holder
  • Small plastic ruler
  • Safety glasses

Depending on which environmental factor you choose to investigate, some of the following items will be needed for your experiment:

  • Acid solutions with pH values between 2 and 6
  • Alkaline solutions with a pH between 8 and 12
  • pH test strips
  • Ice
  • Large plastic beaker (for ice bath)
  • Hot water
  • Large plastic beaker (for hot water bath)
  • Thermometers

Procedure


This part will be determined by the students conducting the experiment. For an overview of the general scientific experimentation and research process, see the flow diagram below. Use the worksheet that follows to write out in detail the hypothesis you are seeking to test, the materials you will use, and the steps you will follow to conduct your experiment.

Enzyme Lab Worksheet


Hypothesis:


Independent Variable: The Different substances tested with the enzymes


Dependent Variable:Enzymes


Controlled Variables:Water (H20)


Justification of hypothesis:hypothesis: Because of knowing High and low ph levels that enzymes lose activity and we would like to see the reaction when you mix hydrogen peroxide with the different chemicals.


Why did you choose this as your hypothesis?
We wanted to test if ph level actually affects the enzymes.

Materials (Your Team’s Experiment):

● Beakers
● Syringe
● Test tubes
● Water
● Bineweed
● Ph 2­3 HC1
● Ph 4 HC1
● Ph 10 Na Oh
● Ph 12 Na Oh


Procedure: Using available chemicals, test the ph reaction with enzymes different solutions and hydrogen peroxide to see their reaction.


Summary:To test different ph solutions to see their reaction with enzymes with hydrogen peroxide.


Detailed Steps:

  • label tubes
  • measure out chemicals
  • mash up bineweed
  • pour water in
  • squeeze out the enzymes
  • pour enzymes into test tubes with chemicals
  • add hydrogen peroxide
  • measure reaction every 3 seconds
  • gather results.


Data and Results:

(This section should include at least one graph!)

Ph 2-3 Hc1
Ph 4 Hc1
Ph 7 Water
Ph 10 Na Oh
Ph 12 Na Oh
0cm
0cm
0cm
0cm
0cm
0cm
0cm
0cm
0cm
0cm
0cm
0cm
0cm
0cm
0cm
0cm
0cm
.01 cm
0cm
.01cm
0cm
0cm
.01 cm
.01cm
.02cm
0cm
0cm
.02cm
.02cm
.03cm
0cm
0cm
.02cm
.04cm
.04cm
0cm
.01cm
.02cm
.06cm
.04cm
0cm
.01cm
.03cm
.08cm
.04cm
0cm
.01cm
.03cm
.08cm
.04cm
0cm
.01cm
.03cm
.08cm
.04cm

Conclusions:There was more bubbles when a higher ph level was included, while the lower ph level solutions did not affect the enzymes. So we can conclude that the higher ph solutions affect the enzymes in a bigger way than lower ph solutions.